🐛 Debugging
In some cases, you'll want to debug your Dart Frog app, and you might have noticed that by adding just the breakpoint, the debugger doesn't stop there like it does by default in a Flutter app. Below, there are three quick and easy options for debugging code in Dart Frog.
Debugging with Dart Frog IDE Extension 🐸
This extension is currently only available for Visual Studio Code, if you are using another IDE, please refer to the Debugging by Attaching to Dart Process section.
-
Go to the Visual Studio Code Marketplace and install the Dart Frog extension. You can also install the extension by searching for
Dart Frogin the extensions tab in Visual Studio Code. -
If you do not have the
Dartextension installed, visit the Dart extension page to install it. You can also install the extension by searching forDartin the extensions tab in Visual Studio Code. -
Open your Dart Frog app within Visual Studio Code.
-
Open the Visual Studio Command Palette by using
Shift+Command+P(Mac) orCtrl+Shift+P(Windows/Linux).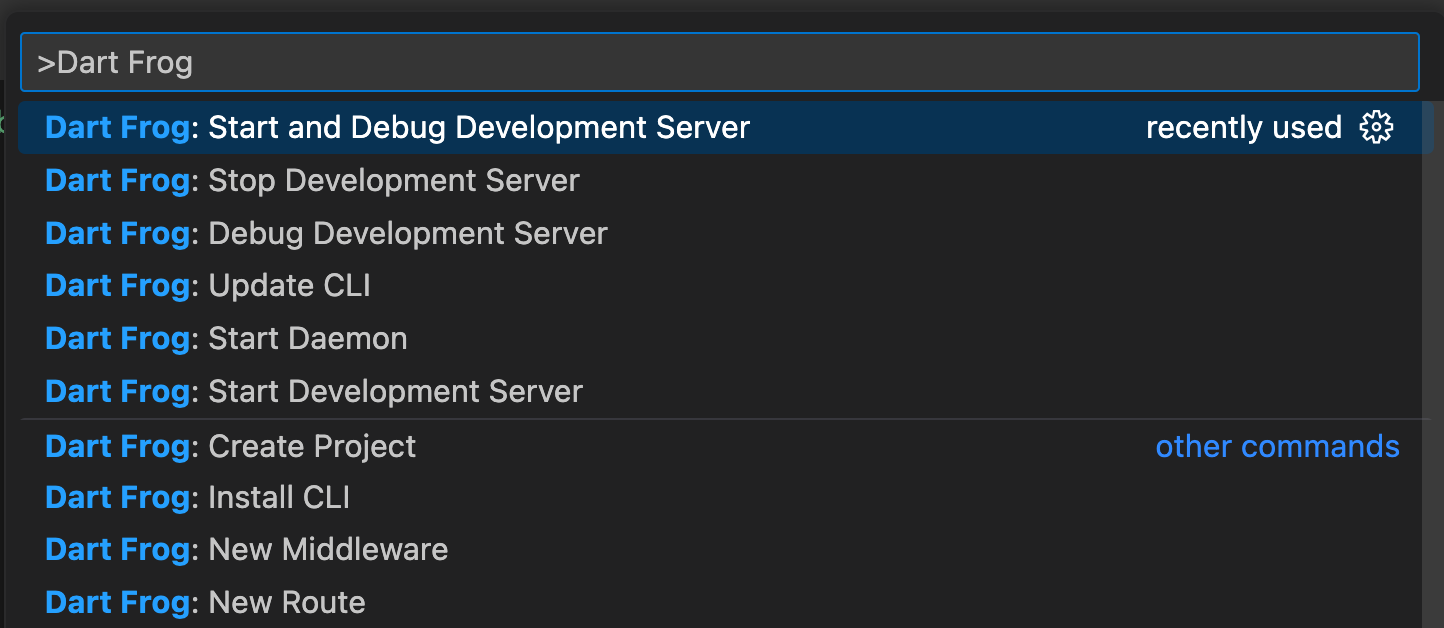
-
Click on the
Dart Frog: Start and Debug Development Serveroption. This will start the Dart Frog server in debug mode.
You can also select the Dart Frog: Debug Development Server option if you already have the server running.
- Add the breakpoints in your code and try to access the endpoint where it gets hit. You will now see that the debugger stops at your breakpoints 🎉.
Another way to run the server in debug mode using the Dart Frog IDE Extension is by using Code Lens in Visual Studio Code.
Debugging by Attaching to Dart Process 🎯
To debug the Dart Frog server using this approach, you should have the Dart extension installed in Visual Studio Code. If you are using another IDE, make sure you have Dart installed.
You can install the extension by searching for Dart in the extensions tab in Visual Studio Code, or directly from the Visual Studio Code marketplace.
- Open your Dart Frog application and run the server using the
dart_frog devcommand. - In the terminal, you'll see something like
The Dart VM service is listening on http://127.0.0.1:8181/XXXXXXXXX/. Copy the URL, as you'll need it in the next steps. - Open the Visual Studio Command Palette by using
Shift+Command+P(Mac) orCtrl+Shift+P(Windows/Linux). - Paste the URL you copied in the previous steps and press
Enter. Now the debugger will stop at the breakpoints you added in your code 🎉.